Titan International PESTLE Analysis
Make Smarter Strategic Decisions with a Complete PESTEL View
Gain a competitive edge with our targeted PESTLE Analysis of Titan International—three to five concise, evidence-based insights show how political, economic, social, technological, legal, and environmental forces shape strategy and risk. Ideal for investors and strategists, the full report offers detailed, actionable intelligence—download now to make smarter, faster decisions.
Political factors
Trade policy and tariffs
Import/export duties such as the US 25% Section 232 steel tariff and average US tariffs on Chinese goods near 19.3% materially raise landed costs for tires, wheels and steel, eroding Titan’s pricing power. Shifts in US–China and EU trade dynamics since 2018 have forced supply-chain reroutes that squeezed margins across the sector. Preferential deals like USMCA and other FTAs can unlock lower-tariff off-highway markets. Sudden tariff hikes force rapid supplier rebalancing and logistics cost spikes.
Agricultural subsidies
Farm support programs affect growers’ replacement cycles; USDA projected net farm income of about $143.7 billion in 2024, supporting stronger demand for ag tires and wheels. Higher subsidy flows historically lift equipment purchases, benefiting Titan’s ag-facing product lines. Policy shifts to sustainability favor low-compaction, soil-friendly products, while cuts or delays can sharply depress order intake and dealer inventories.

Geopolitical stability
Conflict and unrest disrupt raw material sourcing, logistics and customer projects—post-2022 Russia-Ukraine tensions tightened steel/logistics markets and delayed orders. Sanctions (eg Russia, Iran) can curtail sales to regions or OEMs, shrinking addressable markets. Political risk insurance and diversified production reduce exposure; emerging-market sovereign risk premiums commonly add 200–500 bps to financing costs.
Localization incentives
Industrial policies increasingly push localization through tax credits and local-content rules, with many jurisdictions setting thresholds commonly between 30-60%; this boosts Titan’s incentive to expand local manufacturing to win contracts. Local plants improve tender eligibility and lower import frictions, while government procurement (US federal buying >$650B annually in 2023) can favor domestic suppliers. Multi-country footprints raise fixed costs and coordination complexity for operations and supply chain management.
- local-content thresholds: 30-60%
- US government procurement: >$650B (2023)
- benefit: improved tender eligibility/reduced import frictions
- risk: higher fixed costs, coordination complexity
Infrastructure spending
Public works budgets drive earthmoving and construction demand cycles; US Bipartisan Infrastructure Law provides roughly 550 billion in new federal spending through 2026, lifting large-project tire and undercarriage consumption. Stimulus or accelerated appropriations spike OEM orders, while delays stall orders and aftermarket pull-through. Expanded Buy America/local content rules are often bid requirements.
- Public spending: BIL ~550 billion (through 2026)
- Effect: higher tire/undercarriage consumption on mega projects
- Risk: appropriation delays reduce OEM and aftermarket demand
- Compliance: Buy America/local content can be mandatory for bids
US 25% tariffs and 30-60% local-content rules raise costs; public spend backs demand
Tariffs (US 25% Section 232; avg US tariffs on Chinese goods ~19.3%) and post‑2018 trade shifts raise landed costs and squeeze margins. USDA net farm income ~$143.7B (2024) and US public procurement >$650B (2023) support ag and aftermarket demand; BIL ~$550B (through 2026) lifts construction demand. Local‑content rules (30–60%) and sanctions add compliance and market-access costs.
| Factor | 2023–24 Data | Impact |
|---|---|---|
| Tariffs | US 25%; China avg 19.3% | Higher landed costs |
| Farm income | $143.7B (2024) | Supports ag demand |
| Public spend | >$650B procurement; BIL $550B | Boosts construction OEM demand |
| Local content | 30–60% | Drives localization |
What is included in the product
Explores how macro-environmental forces across Political, Economic, Social, Technological, Environmental, and Legal dimensions uniquely impact Titan International, with data-backed trends and region-specific regulatory context. Designed for executives and investors, the analysis highlights actionable risks, opportunities, and forward-looking scenarios ready for inclusion in reports and strategy planning.
A concise, visually segmented PESTLE summary of Titan International that distills external risks and opportunities for quick use in meetings, slide decks, or client reports—editable for regional or business-line notes and easily shareable to align teams.
Economic factors
Commodity price swings
Natural rubber, synthetic rubber, steel and carbon black price swings in 2024–25 materially increased Titan International’s COGS volatility, with input-led cost shocks transmitted into margins due to pricing pass-through lags during down cycles. Hedging programs reduced realized exposure but did not eliminate spot-driven spikes. Supplier diversification and dual-sourcing initiatives improved input continuity and reduced single-supplier risk.
Interest rates and FX
Higher US policy rates (Fed funds around 5.25–5.50% in mid‑2025) dampen capex for farm and construction fleets, lengthening replacement cycles and reducing near‑term demand for Titan’s tires and rims. Dollar strength (DXY ≈105 in mid‑2025) weakens export competitiveness and suppresses translated earnings from foreign subsidiaries. Emerging‑market FX volatility, with frequent 5–10% moves, can disrupt local pricing and margins. Maintaining liquidity and credit access cushions working‑capital needs through these cycles.

Construction and mining cycles
Construction and mining cycles drive Titan International demand as infrastructure, housing and commodities dictate equipment utilization and tire wear; U.S. housing starts averaged about 1.4 million units in 2024, supporting higher replacement rates. Fleet upcycles swell OE and aftermarket volumes while downcycles shift demand toward repair and retread services, with Titan-sensitive mining tire demand tied to metal prices (iron ore ~115 USD/ton in 2024). Backlog visibility from OEMs remains a key production guide, and regional divergence across North America, Latin America and EMEA requires agile allocation of inventory and capacity.
Inflation and labor costs
Wage inflation and elevated logistics pushed operating expenses for manufacturers like Titan—US average hourly earnings rose about 4.1% YoY in 2024 and CPI averaged 3.4% in 2024; freight costs remain roughly 20% above 2019 levels, squeezing margins. Productivity gains and automation (roughly 2–3% productivity lift) can offset unit costs. Persistent inflation complicates price realization given dealer elasticity. Inventory discipline lowers carrying costs amid volatile demand.
- Wage inflation ~4.1% (2024)
- CPI 2024 ~3.4%
- Freight ~20% above 2019
- Automation/productivity ~2–3%
- Inventory discipline reduces carrying costs
Global demand dispersion
Seasonal agricultural cycles create timing mismatches across regions that drive quarter-to-quarter volatility in ag tire demand; Titan reported FY2024 net sales of about $1.6 billion, reflecting sensitivity to harvest timing. Emerging markets (IMF 2024 EM growth ~4.0%) offer structural expansion but higher risk premia and currency exposure. Diversification across ag, construction, and consumer channels smooths revenue, while a strong distributor and aftermarket network underpins resilience and recurring revenue.
- FY2024 net sales ~1.6B
- EM growth ~4.0% (IMF 2024)
- Channel diversification = lower revenue volatility
- Aftermarket strength = recurring, higher-margin sales
US 25% tariffs and 30-60% local-content rules raise costs; public spend backs demand
Input-price shocks in 2024–25 raised COGS volatility; hedging cut but did not remove spikes. Fed funds ~5.25–5.50% (mid‑2025) and DXY ≈105 weighed on demand and exports. FY2024 sales ≈1.6B; US wages +4.1% and CPI 3.4% (2024) pressured OPEX and margin recovery.
| Metric | Value |
|---|---|
| FY2024 sales | $1.6B |
| Fed funds (mid‑2025) | 5.25–5.50% |
| DXY (mid‑2025) | ≈105 |
| US wages (2024) | +4.1% |
| CPI (2024) | 3.4% |
Preview the Actual Deliverable
Titan International PESTLE Analysis
This preview of the Titan International PESTLE Analysis is the exact document you’ll receive after purchase—fully formatted and ready to use. It contains the complete, professionally structured PESTLE assessment, data tables, and strategic implications as shown here. After payment you’ll instantly download this same finalized file with no placeholders or surprises.

Original: $10.00
-70%$10.00
$3.00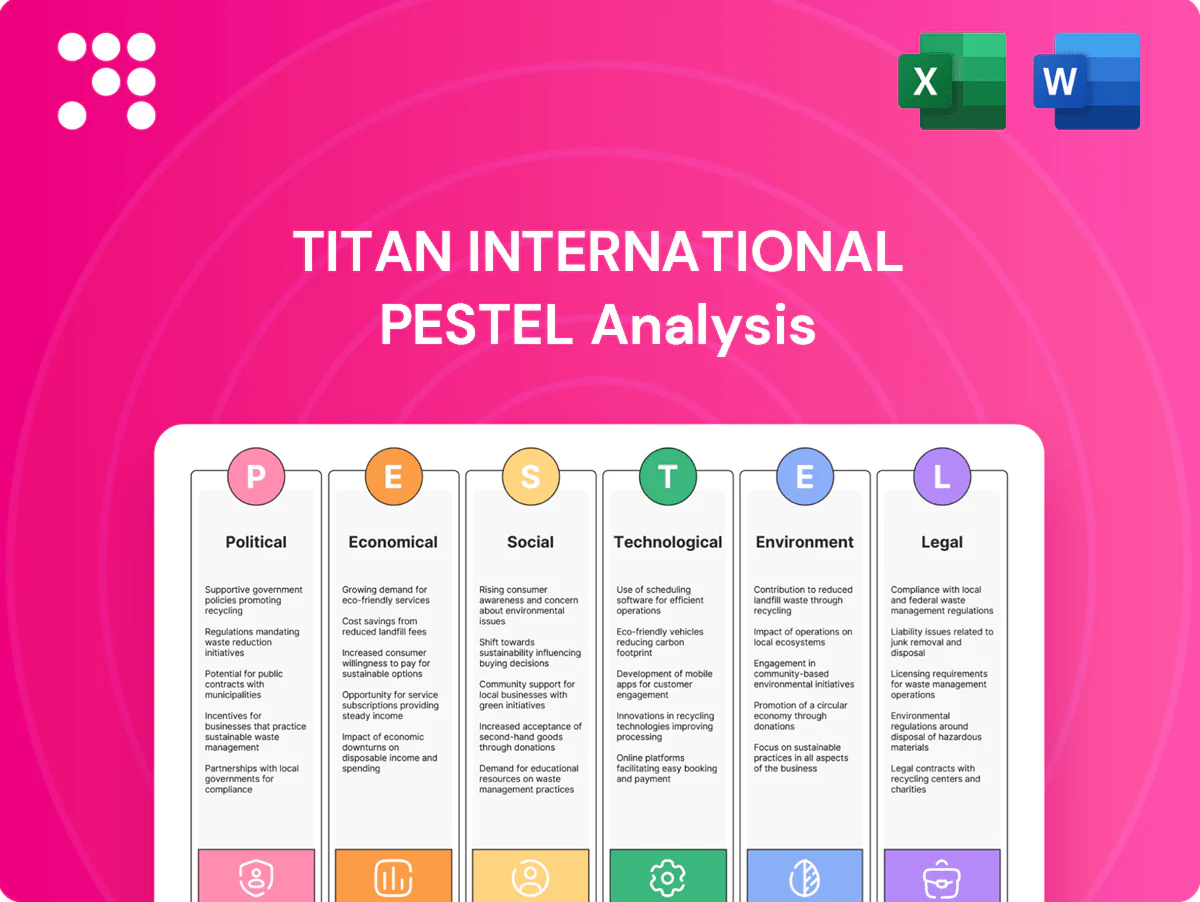
Description
Make Smarter Strategic Decisions with a Complete PESTEL View
Gain a competitive edge with our targeted PESTLE Analysis of Titan International—three to five concise, evidence-based insights show how political, economic, social, technological, legal, and environmental forces shape strategy and risk. Ideal for investors and strategists, the full report offers detailed, actionable intelligence—download now to make smarter, faster decisions.
Political factors
Trade policy and tariffs
Import/export duties such as the US 25% Section 232 steel tariff and average US tariffs on Chinese goods near 19.3% materially raise landed costs for tires, wheels and steel, eroding Titan’s pricing power. Shifts in US–China and EU trade dynamics since 2018 have forced supply-chain reroutes that squeezed margins across the sector. Preferential deals like USMCA and other FTAs can unlock lower-tariff off-highway markets. Sudden tariff hikes force rapid supplier rebalancing and logistics cost spikes.
Agricultural subsidies
Farm support programs affect growers’ replacement cycles; USDA projected net farm income of about $143.7 billion in 2024, supporting stronger demand for ag tires and wheels. Higher subsidy flows historically lift equipment purchases, benefiting Titan’s ag-facing product lines. Policy shifts to sustainability favor low-compaction, soil-friendly products, while cuts or delays can sharply depress order intake and dealer inventories.
Geopolitical stability
Conflict and unrest disrupt raw material sourcing, logistics and customer projects—post-2022 Russia-Ukraine tensions tightened steel/logistics markets and delayed orders. Sanctions (eg Russia, Iran) can curtail sales to regions or OEMs, shrinking addressable markets. Political risk insurance and diversified production reduce exposure; emerging-market sovereign risk premiums commonly add 200–500 bps to financing costs.
Localization incentives
Industrial policies increasingly push localization through tax credits and local-content rules, with many jurisdictions setting thresholds commonly between 30-60%; this boosts Titan’s incentive to expand local manufacturing to win contracts. Local plants improve tender eligibility and lower import frictions, while government procurement (US federal buying >$650B annually in 2023) can favor domestic suppliers. Multi-country footprints raise fixed costs and coordination complexity for operations and supply chain management.
- local-content thresholds: 30-60%
- US government procurement: >$650B (2023)
- benefit: improved tender eligibility/reduced import frictions
- risk: higher fixed costs, coordination complexity
Infrastructure spending
Public works budgets drive earthmoving and construction demand cycles; US Bipartisan Infrastructure Law provides roughly 550 billion in new federal spending through 2026, lifting large-project tire and undercarriage consumption. Stimulus or accelerated appropriations spike OEM orders, while delays stall orders and aftermarket pull-through. Expanded Buy America/local content rules are often bid requirements.
- Public spending: BIL ~550 billion (through 2026)
- Effect: higher tire/undercarriage consumption on mega projects
- Risk: appropriation delays reduce OEM and aftermarket demand
- Compliance: Buy America/local content can be mandatory for bids
US 25% tariffs and 30-60% local-content rules raise costs; public spend backs demand
Tariffs (US 25% Section 232; avg US tariffs on Chinese goods ~19.3%) and post‑2018 trade shifts raise landed costs and squeeze margins. USDA net farm income ~$143.7B (2024) and US public procurement >$650B (2023) support ag and aftermarket demand; BIL ~$550B (through 2026) lifts construction demand. Local‑content rules (30–60%) and sanctions add compliance and market-access costs.
| Factor | 2023–24 Data | Impact |
|---|---|---|
| Tariffs | US 25%; China avg 19.3% | Higher landed costs |
| Farm income | $143.7B (2024) | Supports ag demand |
| Public spend | >$650B procurement; BIL $550B | Boosts construction OEM demand |
| Local content | 30–60% | Drives localization |
What is included in the product
Explores how macro-environmental forces across Political, Economic, Social, Technological, Environmental, and Legal dimensions uniquely impact Titan International, with data-backed trends and region-specific regulatory context. Designed for executives and investors, the analysis highlights actionable risks, opportunities, and forward-looking scenarios ready for inclusion in reports and strategy planning.
A concise, visually segmented PESTLE summary of Titan International that distills external risks and opportunities for quick use in meetings, slide decks, or client reports—editable for regional or business-line notes and easily shareable to align teams.
Economic factors
Commodity price swings
Natural rubber, synthetic rubber, steel and carbon black price swings in 2024–25 materially increased Titan International’s COGS volatility, with input-led cost shocks transmitted into margins due to pricing pass-through lags during down cycles. Hedging programs reduced realized exposure but did not eliminate spot-driven spikes. Supplier diversification and dual-sourcing initiatives improved input continuity and reduced single-supplier risk.
Interest rates and FX
Higher US policy rates (Fed funds around 5.25–5.50% in mid‑2025) dampen capex for farm and construction fleets, lengthening replacement cycles and reducing near‑term demand for Titan’s tires and rims. Dollar strength (DXY ≈105 in mid‑2025) weakens export competitiveness and suppresses translated earnings from foreign subsidiaries. Emerging‑market FX volatility, with frequent 5–10% moves, can disrupt local pricing and margins. Maintaining liquidity and credit access cushions working‑capital needs through these cycles.
Construction and mining cycles
Construction and mining cycles drive Titan International demand as infrastructure, housing and commodities dictate equipment utilization and tire wear; U.S. housing starts averaged about 1.4 million units in 2024, supporting higher replacement rates. Fleet upcycles swell OE and aftermarket volumes while downcycles shift demand toward repair and retread services, with Titan-sensitive mining tire demand tied to metal prices (iron ore ~115 USD/ton in 2024). Backlog visibility from OEMs remains a key production guide, and regional divergence across North America, Latin America and EMEA requires agile allocation of inventory and capacity.
Inflation and labor costs
Wage inflation and elevated logistics pushed operating expenses for manufacturers like Titan—US average hourly earnings rose about 4.1% YoY in 2024 and CPI averaged 3.4% in 2024; freight costs remain roughly 20% above 2019 levels, squeezing margins. Productivity gains and automation (roughly 2–3% productivity lift) can offset unit costs. Persistent inflation complicates price realization given dealer elasticity. Inventory discipline lowers carrying costs amid volatile demand.
- Wage inflation ~4.1% (2024)
- CPI 2024 ~3.4%
- Freight ~20% above 2019
- Automation/productivity ~2–3%
- Inventory discipline reduces carrying costs
Global demand dispersion
Seasonal agricultural cycles create timing mismatches across regions that drive quarter-to-quarter volatility in ag tire demand; Titan reported FY2024 net sales of about $1.6 billion, reflecting sensitivity to harvest timing. Emerging markets (IMF 2024 EM growth ~4.0%) offer structural expansion but higher risk premia and currency exposure. Diversification across ag, construction, and consumer channels smooths revenue, while a strong distributor and aftermarket network underpins resilience and recurring revenue.
- FY2024 net sales ~1.6B
- EM growth ~4.0% (IMF 2024)
- Channel diversification = lower revenue volatility
- Aftermarket strength = recurring, higher-margin sales
US 25% tariffs and 30-60% local-content rules raise costs; public spend backs demand
Input-price shocks in 2024–25 raised COGS volatility; hedging cut but did not remove spikes. Fed funds ~5.25–5.50% (mid‑2025) and DXY ≈105 weighed on demand and exports. FY2024 sales ≈1.6B; US wages +4.1% and CPI 3.4% (2024) pressured OPEX and margin recovery.
| Metric | Value |
|---|---|
| FY2024 sales | $1.6B |
| Fed funds (mid‑2025) | 5.25–5.50% |
| DXY (mid‑2025) | ≈105 |
| US wages (2024) | +4.1% |
| CPI (2024) | 3.4% |
Preview the Actual Deliverable
Titan International PESTLE Analysis
This preview of the Titan International PESTLE Analysis is the exact document you’ll receive after purchase—fully formatted and ready to use. It contains the complete, professionally structured PESTLE assessment, data tables, and strategic implications as shown here. After payment you’ll instantly download this same finalized file with no placeholders or surprises.