WidePoint Porter's Five Forces Analysis
Go Beyond the Preview—Access the Full Strategic Report
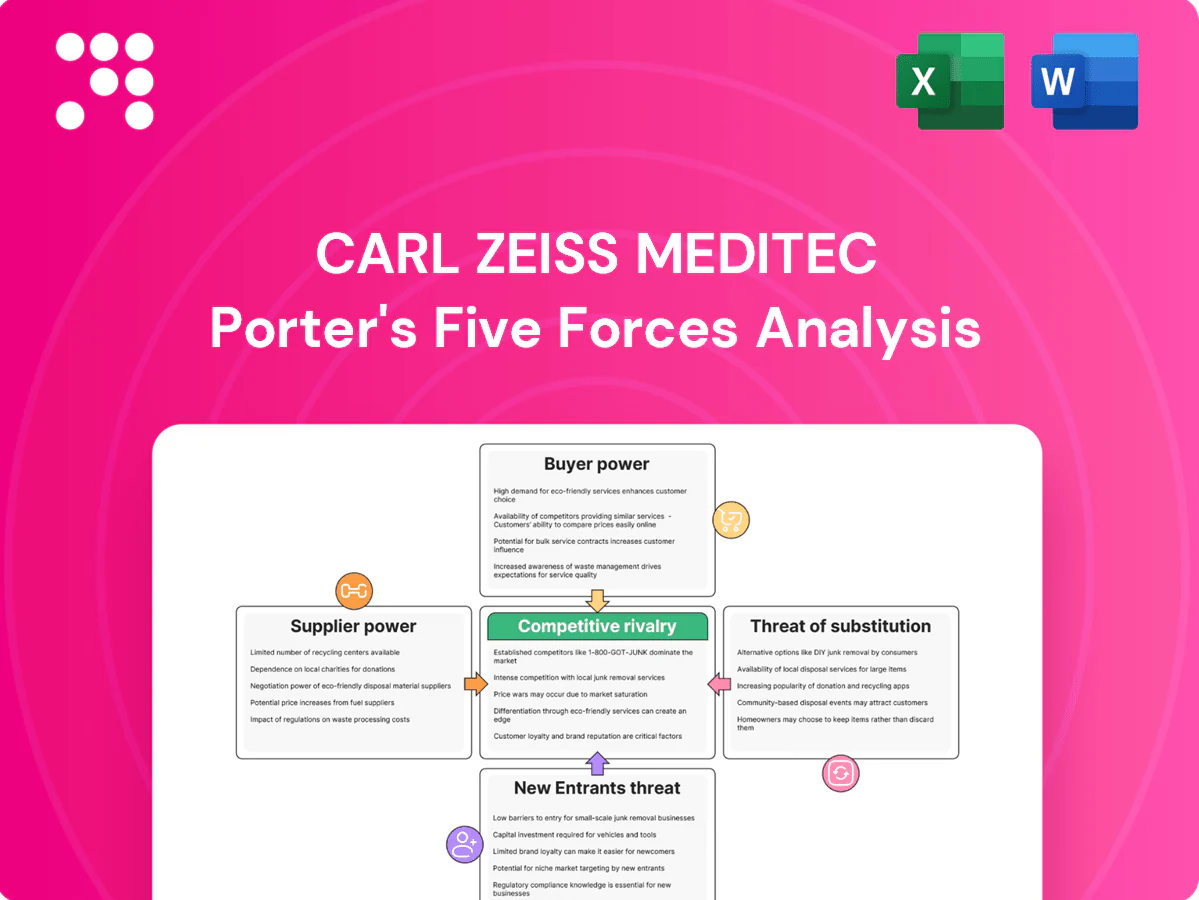
WidePoint operates in a complex telecom and managed services niche where supplier leverage, contract-driven buyer power, and evolving tech substitutes shape margins and growth. Our snapshot highlights key competitive tensions and regulatory sensitivities. This brief only scratches the surface. Unlock the full Porter's Five Forces Analysis to explore force-by-force ratings, visuals, and actionable strategy.
Suppliers Bargaining Power
Carrier and OEM concentration
Major telecom carriers and device OEMs are highly concentrated, giving them pricing and contract leverage over WidePoint’s TM2. The top three US carriers control roughly 90% of subscribers and Apple held about 60% of the US smartphone market in 2024, concentrating supplier power. Limited alternatives for carrier data feeds, provisioning APIs, and specific devices heighten influence. Volume and term commitments can partially offset this supplier power.
Security-certified tool scarcity
Using FedRAMP, FIPS-validated, and DoD-approved components narrows the vendor set—FedRAMP marketplace listed about 1,600 authorized solutions and NIST CMVP showed over 6,000 validated modules in 2024, concentrating supply. Scarcity of compliant cybersecurity tools raises switching costs and supplier bargaining power, reinforced by approvals and ATO dependencies that limit substitutions. Vendors leverage this to push maintenance and multi-year (3–5 year) support terms favorably.

Cloud and hosting dependencies
Reliance on hyperscalers concentrates spend—AWS 32%, Azure 23%, GCP 11% (Synergy Research, 2024)—driving dependency for compliant workloads. Egress fees (commonly $0.05–$0.12/GB), reserved instances (savings up to 72%) and compliance add-ons create contractual lock‑in. Multi‑cloud reduces vendor risk but raises operational complexity and can add ~20% cost/coordination overhead. Enterprise agreements lower list prices but large providers keep negotiating leverage.
Specialized talent suppliers
Clearable, certified engineers and SOC analysts remain scarce, with the (ISC)2 2023 global cybersecurity workforce gap at 3.4 million and continued 2024 demand driving premium pay; staffing firms and subcontractors routinely command 25–40% rate spreads on surge staffing. Government surge work in 2024 amplified wage pressure, while long-term labor partnerships can stabilize costs but reduce staffing flexibility.
- Scarcity: cleared/certified talent high demand
- Premiums: 25–40% rate spreads (staffing/subcontractors)
- Govt surge: increases wage pressure in 2024
- Long-term deals: cost stability vs flexibility loss
Integration and data providers
Billing, analytics, and identity data sources become highly sticky after integration, with proprietary schemas and connectors raising switching friction and often anchoring customers into 1–3 year contracts; vendors can leverage access terms to shape product roadmaps and feature priorities.
- Sticky integrations raise switching costs
- Proprietary schemas increase friction
- Vendors influence roadmaps via access
- Contractual SLAs and data rights are key levers
Carrier/device concentration, hyperscaler lock-in and cleared talent gap squeeze pricing power
Major carriers and device OEMs concentrate power (top 3 carriers ~90% share; Apple ~60% US smartphones, 2024), limiting TM2 pricing flexibility. Compliant vendor pool is narrow (FedRAMP ~1,600; NIST CMVP ~6,000 modules, 2024), raising switching costs. Hyperscalers dominate (AWS 32%, Azure 23%, GCP 11%, 2024) and egress/commitment fees lock customers. Cleared talent gap ~3.4M (ISC2 2023) keeps staffing premiums high.
| Item | 2024 Data |
|---|---|
| Top carriers | ~90% |
| Apple US phones | ~60% |
| AWS/Azure/GCP | 32%/23%/11% |
What is included in the product
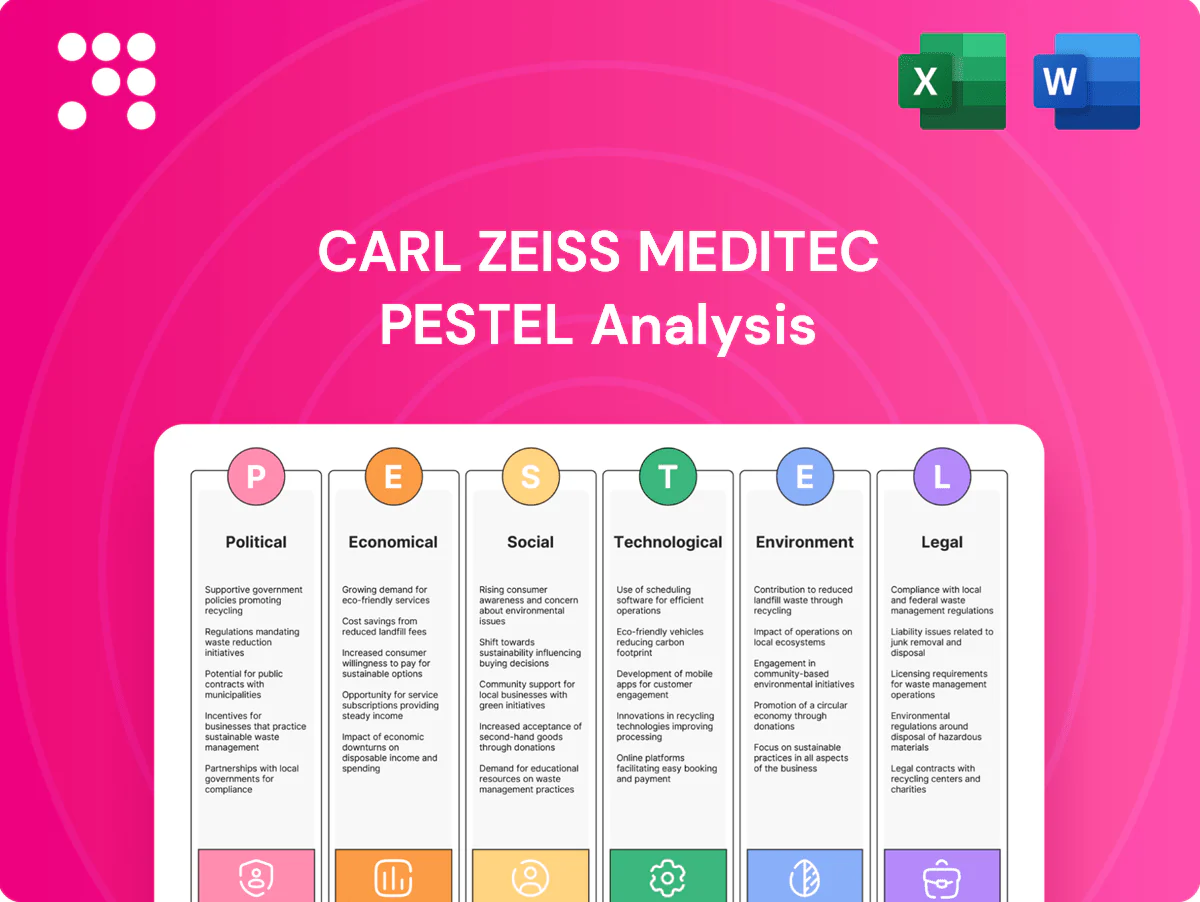
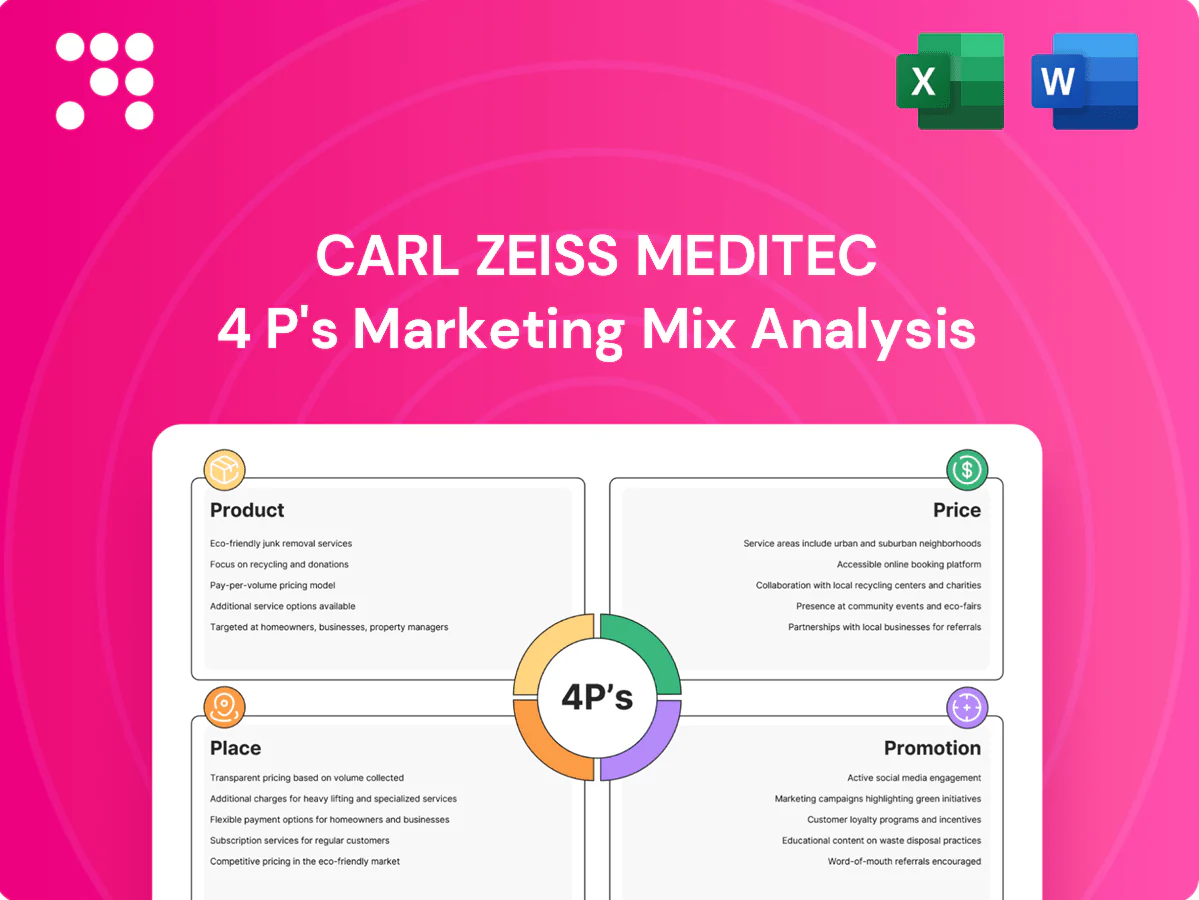
Tailored Porter’s Five Forces analysis for WidePoint that uncovers competitive drivers, buyer and supplier power, entry barriers, substitute threats, and disruptive forces—supported by strategic insights to inform investor materials, internal strategy, or academic use.
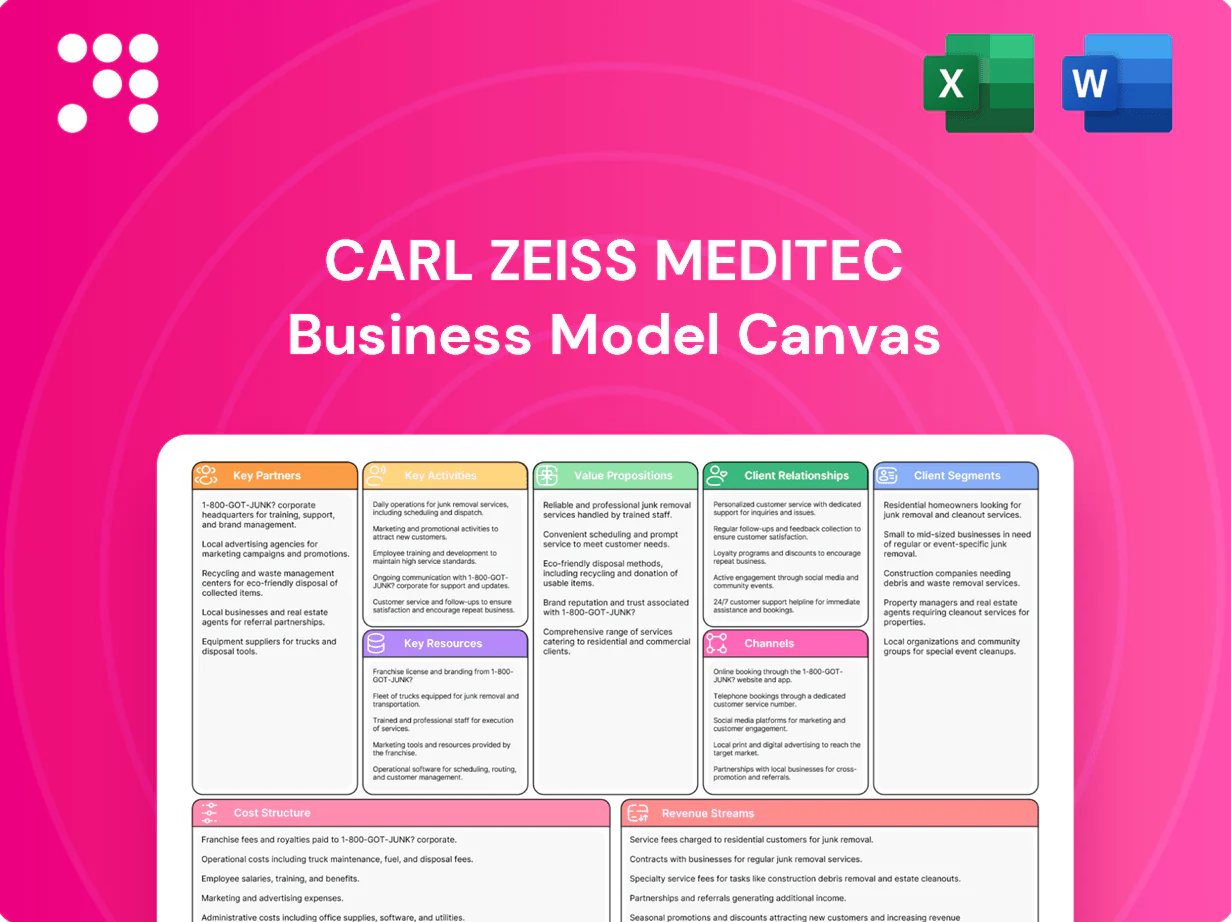
A concise, one-sheet Porter's Five Forces for WidePoint—visualize competitive pressures with an editable radar chart and copy-ready layout to speed boardroom decisions.
Customers Bargaining Power
Large government procurement
Federal agencies procure via RFPs, IDIQs and GWACs that concentrate over $100 billion of annual federal IT spend into tens of billions of GWAC/IDIQ awards, amplifying buyer bargaining power. Stringent SLAs, audit rights and FedRAMP/security controls are contract norms. Competitive bidding and option‑year negotiations drive pricing pressure, while CPARS/past performance records tightly discipline vendors.
Enterprise scale and standardization
Large commercial buyers consolidate mobile spend across regions, demanding volume discounts, standardized rate cards, and benchmarking to drive cost savings, a trend that intensified in 2024.
Standardized integrations and APIs increase switching ability by lowering technical barriers and reducing migration costs.
Vendor-neutral reporting and benchmarking tools progressively erode vendor lock-in, enabling CIOs to re-bid services based on performance and price.

High switching costs, but visible
Process re-mapping, ATOs and data migration create material switching frictions, raising operational risk and downtime during vendor moves. Mature data export tools and widespread carrier portability make alternatives viable despite friction. Buyers routinely leverage incumbents against challengers during rebids. In 2024 many enterprise deals use 3-year terms trading price discounts for commitment.
Outcome and compliance focus
Buyers in 2024 prioritize cost savings, security posture, and auditability, tying fees to KPIs such as optimization yield, ticket SLAs, and compliance milestones; poor performance triggers credits or termination for cause, increasing supplier risk and reducing pricing power.
- Outcome-driven fees
- SLAs enforce credits/termination
- Visibility raises buyer leverage
Insourcing options exist
Larger IT organizations in 2024 can build internal TM2 capabilities using mature UEM, TEM tools, and analytics stacks, creating a credible insourcing option that caps vendor pricing and shifts negotiations. Hybrid co-managed models proliferating in 2024 expand buyer choice, while contractual knowledge transfer clauses reduce long-term vendor dependency and leverage for customers.
- 2024 trend: rise of UEM/TEM enabling insourcing
- Insourcing threat caps vendor pricing
- Hybrid co-managed models increase options
- Knowledge transfer clauses lower vendor lock-in
Buyers wield leverage: federal IT $100B+ drives deep discounts
Buyers hold strong leverage: federal procurement concentrates over $100 billion annual IT spend into tens of billions of GWAC/IDIQ awards, driving price pressure via RFPs, SLAs, CPARS and rebids. Large enterprises in 2024 demand volume discounts, outcome fees and 3-year commitments, while UEM/TEM maturity enables credible insourcing, capping vendor pricing and increasing switching options.
| Metric | 2024 value |
|---|---|
| US federal IT spend | Over $100 billion |
| GWAC/IDIQ concentration | Tens of billions |
| Common enterprise deal term | 3 years |
Preview the Actual Deliverable
WidePoint Porter's Five Forces Analysis
This WidePoint Porter’s Five Forces Analysis preview is the exact document you’ll receive upon purchase—no placeholders or samples. It’s fully formatted, professionally written, and ready for immediate download and use. The content shown is the final deliverable, delivered instantly after payment. No surprises—what you see is what you get.

Original: $10.00
-70%$10.00
$3.00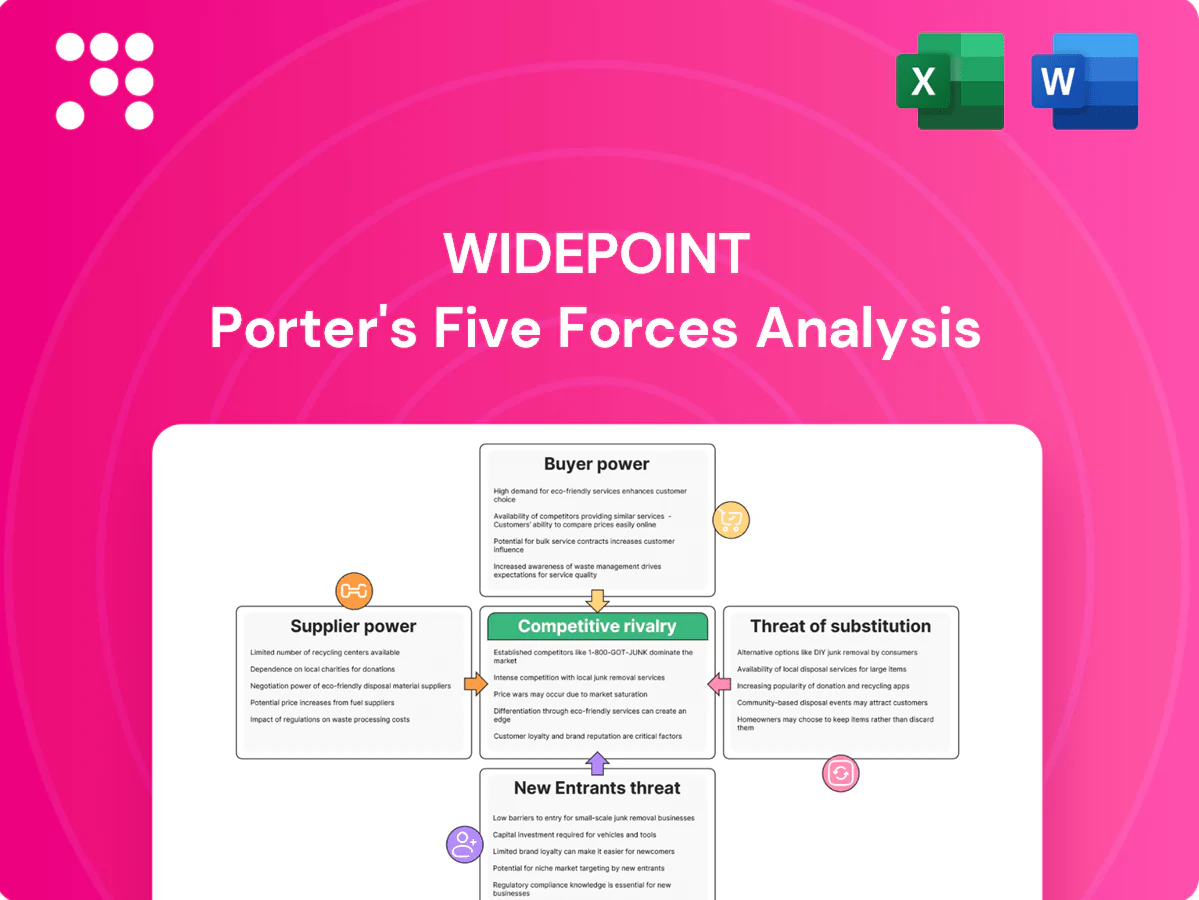
Description
Go Beyond the Preview—Access the Full Strategic Report
WidePoint operates in a complex telecom and managed services niche where supplier leverage, contract-driven buyer power, and evolving tech substitutes shape margins and growth. Our snapshot highlights key competitive tensions and regulatory sensitivities. This brief only scratches the surface. Unlock the full Porter's Five Forces Analysis to explore force-by-force ratings, visuals, and actionable strategy.
Suppliers Bargaining Power
Carrier and OEM concentration
Major telecom carriers and device OEMs are highly concentrated, giving them pricing and contract leverage over WidePoint’s TM2. The top three US carriers control roughly 90% of subscribers and Apple held about 60% of the US smartphone market in 2024, concentrating supplier power. Limited alternatives for carrier data feeds, provisioning APIs, and specific devices heighten influence. Volume and term commitments can partially offset this supplier power.
Security-certified tool scarcity
Using FedRAMP, FIPS-validated, and DoD-approved components narrows the vendor set—FedRAMP marketplace listed about 1,600 authorized solutions and NIST CMVP showed over 6,000 validated modules in 2024, concentrating supply. Scarcity of compliant cybersecurity tools raises switching costs and supplier bargaining power, reinforced by approvals and ATO dependencies that limit substitutions. Vendors leverage this to push maintenance and multi-year (3–5 year) support terms favorably.
Cloud and hosting dependencies
Reliance on hyperscalers concentrates spend—AWS 32%, Azure 23%, GCP 11% (Synergy Research, 2024)—driving dependency for compliant workloads. Egress fees (commonly $0.05–$0.12/GB), reserved instances (savings up to 72%) and compliance add-ons create contractual lock‑in. Multi‑cloud reduces vendor risk but raises operational complexity and can add ~20% cost/coordination overhead. Enterprise agreements lower list prices but large providers keep negotiating leverage.
Specialized talent suppliers
Clearable, certified engineers and SOC analysts remain scarce, with the (ISC)2 2023 global cybersecurity workforce gap at 3.4 million and continued 2024 demand driving premium pay; staffing firms and subcontractors routinely command 25–40% rate spreads on surge staffing. Government surge work in 2024 amplified wage pressure, while long-term labor partnerships can stabilize costs but reduce staffing flexibility.
- Scarcity: cleared/certified talent high demand
- Premiums: 25–40% rate spreads (staffing/subcontractors)
- Govt surge: increases wage pressure in 2024
- Long-term deals: cost stability vs flexibility loss
Integration and data providers
Billing, analytics, and identity data sources become highly sticky after integration, with proprietary schemas and connectors raising switching friction and often anchoring customers into 1–3 year contracts; vendors can leverage access terms to shape product roadmaps and feature priorities.
- Sticky integrations raise switching costs
- Proprietary schemas increase friction
- Vendors influence roadmaps via access
- Contractual SLAs and data rights are key levers
Carrier/device concentration, hyperscaler lock-in and cleared talent gap squeeze pricing power
Major carriers and device OEMs concentrate power (top 3 carriers ~90% share; Apple ~60% US smartphones, 2024), limiting TM2 pricing flexibility. Compliant vendor pool is narrow (FedRAMP ~1,600; NIST CMVP ~6,000 modules, 2024), raising switching costs. Hyperscalers dominate (AWS 32%, Azure 23%, GCP 11%, 2024) and egress/commitment fees lock customers. Cleared talent gap ~3.4M (ISC2 2023) keeps staffing premiums high.
| Item | 2024 Data |
|---|---|
| Top carriers | ~90% |
| Apple US phones | ~60% |
| AWS/Azure/GCP | 32%/23%/11% |
What is included in the product
Tailored Porter’s Five Forces analysis for WidePoint that uncovers competitive drivers, buyer and supplier power, entry barriers, substitute threats, and disruptive forces—supported by strategic insights to inform investor materials, internal strategy, or academic use.
A concise, one-sheet Porter's Five Forces for WidePoint—visualize competitive pressures with an editable radar chart and copy-ready layout to speed boardroom decisions.
Customers Bargaining Power
Large government procurement
Federal agencies procure via RFPs, IDIQs and GWACs that concentrate over $100 billion of annual federal IT spend into tens of billions of GWAC/IDIQ awards, amplifying buyer bargaining power. Stringent SLAs, audit rights and FedRAMP/security controls are contract norms. Competitive bidding and option‑year negotiations drive pricing pressure, while CPARS/past performance records tightly discipline vendors.
Enterprise scale and standardization
Large commercial buyers consolidate mobile spend across regions, demanding volume discounts, standardized rate cards, and benchmarking to drive cost savings, a trend that intensified in 2024.
Standardized integrations and APIs increase switching ability by lowering technical barriers and reducing migration costs.
Vendor-neutral reporting and benchmarking tools progressively erode vendor lock-in, enabling CIOs to re-bid services based on performance and price.
High switching costs, but visible
Process re-mapping, ATOs and data migration create material switching frictions, raising operational risk and downtime during vendor moves. Mature data export tools and widespread carrier portability make alternatives viable despite friction. Buyers routinely leverage incumbents against challengers during rebids. In 2024 many enterprise deals use 3-year terms trading price discounts for commitment.
Outcome and compliance focus
Buyers in 2024 prioritize cost savings, security posture, and auditability, tying fees to KPIs such as optimization yield, ticket SLAs, and compliance milestones; poor performance triggers credits or termination for cause, increasing supplier risk and reducing pricing power.
- Outcome-driven fees
- SLAs enforce credits/termination
- Visibility raises buyer leverage
Insourcing options exist
Larger IT organizations in 2024 can build internal TM2 capabilities using mature UEM, TEM tools, and analytics stacks, creating a credible insourcing option that caps vendor pricing and shifts negotiations. Hybrid co-managed models proliferating in 2024 expand buyer choice, while contractual knowledge transfer clauses reduce long-term vendor dependency and leverage for customers.
- 2024 trend: rise of UEM/TEM enabling insourcing
- Insourcing threat caps vendor pricing
- Hybrid co-managed models increase options
- Knowledge transfer clauses lower vendor lock-in
Buyers wield leverage: federal IT $100B+ drives deep discounts
Buyers hold strong leverage: federal procurement concentrates over $100 billion annual IT spend into tens of billions of GWAC/IDIQ awards, driving price pressure via RFPs, SLAs, CPARS and rebids. Large enterprises in 2024 demand volume discounts, outcome fees and 3-year commitments, while UEM/TEM maturity enables credible insourcing, capping vendor pricing and increasing switching options.
| Metric | 2024 value |
|---|---|
| US federal IT spend | Over $100 billion |
| GWAC/IDIQ concentration | Tens of billions |
| Common enterprise deal term | 3 years |
Preview the Actual Deliverable
WidePoint Porter's Five Forces Analysis
This WidePoint Porter’s Five Forces Analysis preview is the exact document you’ll receive upon purchase—no placeholders or samples. It’s fully formatted, professionally written, and ready for immediate download and use. The content shown is the final deliverable, delivered instantly after payment. No surprises—what you see is what you get.