Wharf (Holdings) SWOT Analysis
Your Strategic Toolkit Starts Here
Wharf Holdings combines prime Hong Kong real estate and growing logistics/transport platforms, giving stable cashflow and diversification, but it faces cyclical property risk and regulatory exposure in Greater China. Want actionable insights and model-ready tools? Purchase the full SWOT analysis for a professionally formatted Word report and editable Excel matrix to plan and pitch with confidence.
Strengths
Premium mixed-asset portfolio
The group develops and owns high-quality commercial and residential assets, underpinning brand premium and pricing power; its investment portfolio is valued at about HK$165 billion (FY2024). Mixed-use exposure balances cyclical swings between sales and rentals, smoothing revenue volatility. Prime locations drive strong footfall and tenant quality, supporting occupancy rates above 95% and resilient cash flows.
Diversified across property and logistics
Operations span development, investment properties, container terminals and warehousing, and in 2024 Wharf’s logistics arm delivered resilient cashflows that cushioned softer property sales; integrated capabilities allow end-to-end solutions for tenants and shippers, reducing single-segment dependency and supporting stable group earnings through market cycles.

Strong Hong Kong and mainland footprint
Wharf leverages a deep Hong Kong footprint (population c.7.5m) and presence in key mainland cities across the 11‑city Greater Bay Area (c.86m people), giving scale and market insight. Local relationships support land acquisition, approvals and leasing, while assets like Harbour City (450+ shops) help capture GBA demand flows and reduce execution risk versus new entrants.
Integrated value chain capabilities
Integrated value-chain capabilities — from site assembly and construction to leasing and asset management — lift margins by shortening development cycles and capturing construction-to-rent upside; operational synergies tighten cost control and speed execution. Logistics assets complement commercial property offerings, strengthening tenant stickiness and improving lifecycle returns; Harbour City alone houses over 700 shops as of 2024.
- End-to-end development and asset mgmt
- Faster delivery, lower unit costs
- Logistics-property cross-selling
- Higher tenant retention, stronger NOI
Brand and stakeholder relationships
Wharf's strong brand attracts blue-chip tenants, keeping core retail and office occupancy above 90% and supporting premium rents. Long-standing banking and contractor ties secure financing and on-time delivery for assets such as Harbour City and Times Square. Close government and community engagement helps fast-track approvals, lowering vacancy and marketing costs.
- Blue-chip tenant pull; >90% occupancy
- Banking/contractor relationships ensure delivery
- Government/community ties ease approvals
- Brand equity cuts marketing spend and downtime
Premium mixed-use portfolio HK$165bn, core occupancy > 95%, flagship mall c.700 shops
Wharf owns premium mixed-use assets (investment portfolio ~HK$165bn in FY2024), driving pricing power and occupancy >95% in core assets. Integrated operations—property, logistics and terminals—delivered resilient cashflows in 2024, reducing cycle risk. Strong GBA footprint and Harbour City scale (c.700+ shops) support tenant quality and stable NOI.
| Metric | 2024 |
|---|---|
| Investment portfolio | HK$165bn |
| Core occupancy | >95% |
| Harbour City shops | c.700 |
What is included in the product
Delivers a strategic overview of Wharf (Holdings)’s internal and external business factors, outlining strengths, weaknesses, opportunities and threats to assess its competitive position, key growth drivers, operational gaps and market risks.
Provides a concise SWOT matrix highlighting Wharf (Holdings)’s strengths, weaknesses, opportunities and threats for rapid strategy alignment, quick stakeholder updates, and easy integration into reports and presentations.
Weaknesses
High capital intensity
Property and port assets demand heavy upfront investment and often have payback horizons of 10+ years, raising Wharf (Holdings) sensitivity to interest rates and credit cycles as policy rates rose toward 5.25% in 2023–24. Large capex commitments limit nimbleness in downturns, while prolonged leasing or sales delays inflate carrying costs and compress returns.
Geographic concentration risk
Reliance on Hong Kong and mainland China concentrates macro and policy exposure: over 50% of Wharf (Holdings) assets and revenue derive from these markets (2024). Localized downturns or regulatory changes can materially hit cash flows and NAV, as seen in recent Hong Kong retail and office weakness. Diversification outside these markets remains limited, so correlated shocks reduce portfolio spread benefits.

Earnings cyclicality in development
Development revenues at Wharf are highly lumpy, driven by the timing of project launches and handovers, which makes near-term profit visibility volatile; market downturns can force pricing concessions and margin compression. Inventory build-ups tie up capital and elevate holding risk, increasing financing and carrying costs and magnifying earnings cyclicality.
Port and warehousing margin pressure
Container terminals face structural overcapacity and intense price competition as shifting trade lanes and alliance rerouting increase throughput volatility, compressing Wharf’s operating leverage; rising energy and labour costs further squeeze unit economics and margin per TEU.
- Overcapacity & price pressure
- Throughput volatility → lower operating leverage
- Higher energy/labour unit costs
- Alternative ports/alliances can divert volumes
Legacy non-core exposures
Investments in communications, media and entertainment distract Wharf from core property and logistics operations, with monetization paths often unclear and return profiles uneven.
Management attention is split across disparate businesses, reducing strategic focus and operational efficiency.
Valuation transparency for minority or non-listed stakes is limited, complicating investor assessment of true asset value.
- Distraction from core ops
- Uncertain monetization
- Split management focus
- Opaque minority valuations
Peak 5.25% rates and >50% HK/China exposure strain capex
Heavy, long‑dated capex and sensitivity to rising policy rates (peak ~5.25% in 2023–24) compress returns and limit agility. Over 50% of assets/revenue remain concentrated in Hong Kong/Mainland China (2024), raising correlated macro‑policy risk. Lumpy development profits, terminal overcapacity and non‑core investments dilute cashflow visibility and management focus.
| Weakness | Key metric (2024) |
|---|---|
| Rate/capex sensitivity | Policy rates ~5.25% |
| Geographic concentration | >50% assets/rev HK+China |
| Operational opacity | Opaque minority valuations |
Same Document Delivered
Wharf (Holdings) SWOT Analysis
This is the actual SWOT analysis document for Wharf (Holdings) you’ll receive upon purchase—no surprises, just professional quality and structured insights into strengths, weaknesses, opportunities and threats. The preview below is taken directly from the full SWOT report you'll get; buy now to unlock the complete, editable version. The file shown is the real analysis available immediately after payment.

Original: $10.00
-70%$10.00
$3.00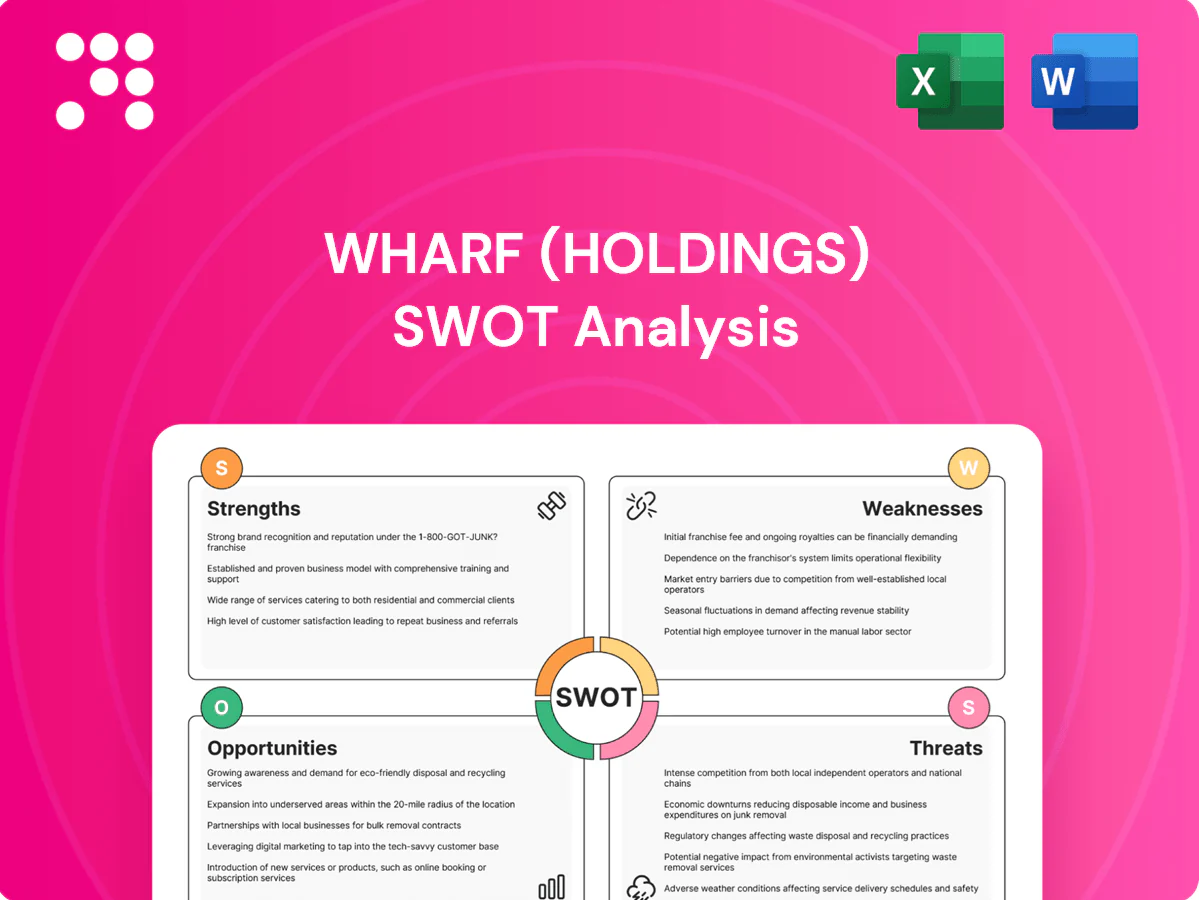
Description
Your Strategic Toolkit Starts Here
Wharf Holdings combines prime Hong Kong real estate and growing logistics/transport platforms, giving stable cashflow and diversification, but it faces cyclical property risk and regulatory exposure in Greater China. Want actionable insights and model-ready tools? Purchase the full SWOT analysis for a professionally formatted Word report and editable Excel matrix to plan and pitch with confidence.
Strengths
Premium mixed-asset portfolio
The group develops and owns high-quality commercial and residential assets, underpinning brand premium and pricing power; its investment portfolio is valued at about HK$165 billion (FY2024). Mixed-use exposure balances cyclical swings between sales and rentals, smoothing revenue volatility. Prime locations drive strong footfall and tenant quality, supporting occupancy rates above 95% and resilient cash flows.
Diversified across property and logistics
Operations span development, investment properties, container terminals and warehousing, and in 2024 Wharf’s logistics arm delivered resilient cashflows that cushioned softer property sales; integrated capabilities allow end-to-end solutions for tenants and shippers, reducing single-segment dependency and supporting stable group earnings through market cycles.
Strong Hong Kong and mainland footprint
Wharf leverages a deep Hong Kong footprint (population c.7.5m) and presence in key mainland cities across the 11‑city Greater Bay Area (c.86m people), giving scale and market insight. Local relationships support land acquisition, approvals and leasing, while assets like Harbour City (450+ shops) help capture GBA demand flows and reduce execution risk versus new entrants.
Integrated value chain capabilities
Integrated value-chain capabilities — from site assembly and construction to leasing and asset management — lift margins by shortening development cycles and capturing construction-to-rent upside; operational synergies tighten cost control and speed execution. Logistics assets complement commercial property offerings, strengthening tenant stickiness and improving lifecycle returns; Harbour City alone houses over 700 shops as of 2024.
- End-to-end development and asset mgmt
- Faster delivery, lower unit costs
- Logistics-property cross-selling
- Higher tenant retention, stronger NOI
Brand and stakeholder relationships
Wharf's strong brand attracts blue-chip tenants, keeping core retail and office occupancy above 90% and supporting premium rents. Long-standing banking and contractor ties secure financing and on-time delivery for assets such as Harbour City and Times Square. Close government and community engagement helps fast-track approvals, lowering vacancy and marketing costs.
- Blue-chip tenant pull; >90% occupancy
- Banking/contractor relationships ensure delivery
- Government/community ties ease approvals
- Brand equity cuts marketing spend and downtime
Premium mixed-use portfolio HK$165bn, core occupancy > 95%, flagship mall c.700 shops
Wharf owns premium mixed-use assets (investment portfolio ~HK$165bn in FY2024), driving pricing power and occupancy >95% in core assets. Integrated operations—property, logistics and terminals—delivered resilient cashflows in 2024, reducing cycle risk. Strong GBA footprint and Harbour City scale (c.700+ shops) support tenant quality and stable NOI.
| Metric | 2024 |
|---|---|
| Investment portfolio | HK$165bn |
| Core occupancy | >95% |
| Harbour City shops | c.700 |
What is included in the product
Delivers a strategic overview of Wharf (Holdings)’s internal and external business factors, outlining strengths, weaknesses, opportunities and threats to assess its competitive position, key growth drivers, operational gaps and market risks.
Provides a concise SWOT matrix highlighting Wharf (Holdings)’s strengths, weaknesses, opportunities and threats for rapid strategy alignment, quick stakeholder updates, and easy integration into reports and presentations.
Weaknesses
High capital intensity
Property and port assets demand heavy upfront investment and often have payback horizons of 10+ years, raising Wharf (Holdings) sensitivity to interest rates and credit cycles as policy rates rose toward 5.25% in 2023–24. Large capex commitments limit nimbleness in downturns, while prolonged leasing or sales delays inflate carrying costs and compress returns.
Geographic concentration risk
Reliance on Hong Kong and mainland China concentrates macro and policy exposure: over 50% of Wharf (Holdings) assets and revenue derive from these markets (2024). Localized downturns or regulatory changes can materially hit cash flows and NAV, as seen in recent Hong Kong retail and office weakness. Diversification outside these markets remains limited, so correlated shocks reduce portfolio spread benefits.
Earnings cyclicality in development
Development revenues at Wharf are highly lumpy, driven by the timing of project launches and handovers, which makes near-term profit visibility volatile; market downturns can force pricing concessions and margin compression. Inventory build-ups tie up capital and elevate holding risk, increasing financing and carrying costs and magnifying earnings cyclicality.
Port and warehousing margin pressure
Container terminals face structural overcapacity and intense price competition as shifting trade lanes and alliance rerouting increase throughput volatility, compressing Wharf’s operating leverage; rising energy and labour costs further squeeze unit economics and margin per TEU.
- Overcapacity & price pressure
- Throughput volatility → lower operating leverage
- Higher energy/labour unit costs
- Alternative ports/alliances can divert volumes
Legacy non-core exposures
Investments in communications, media and entertainment distract Wharf from core property and logistics operations, with monetization paths often unclear and return profiles uneven.
Management attention is split across disparate businesses, reducing strategic focus and operational efficiency.
Valuation transparency for minority or non-listed stakes is limited, complicating investor assessment of true asset value.
- Distraction from core ops
- Uncertain monetization
- Split management focus
- Opaque minority valuations
Peak 5.25% rates and >50% HK/China exposure strain capex
Heavy, long‑dated capex and sensitivity to rising policy rates (peak ~5.25% in 2023–24) compress returns and limit agility. Over 50% of assets/revenue remain concentrated in Hong Kong/Mainland China (2024), raising correlated macro‑policy risk. Lumpy development profits, terminal overcapacity and non‑core investments dilute cashflow visibility and management focus.
| Weakness | Key metric (2024) |
|---|---|
| Rate/capex sensitivity | Policy rates ~5.25% |
| Geographic concentration | >50% assets/rev HK+China |
| Operational opacity | Opaque minority valuations |
Same Document Delivered
Wharf (Holdings) SWOT Analysis
This is the actual SWOT analysis document for Wharf (Holdings) you’ll receive upon purchase—no surprises, just professional quality and structured insights into strengths, weaknesses, opportunities and threats. The preview below is taken directly from the full SWOT report you'll get; buy now to unlock the complete, editable version. The file shown is the real analysis available immediately after payment.